
Nielsen: What people watch, what people buy

Selling the understanding of what consumers watch, what they buy, and how those intersect
Every goods company wants everyone use their product. But how to analyze consumer taste, consistency, and way of thinking nationally or even globally? How can advertising industry be informed of accurate, consistent measures from their own campaigns? How to understand the true impact of investing in ads?
Nielsen as a global research and consulting company focused primarily on global information and media. It conducts research and data analysis to measure some information mainly about marketing: fast-moving consumer goods, consumer behavior, and media such as television, can provide that kind of insightful analysis. As the number 1 among top 50 Market Research Firms in the US, Nielsen consistently understanding consumers’ subconscious response to ads. There are basically three things on how Nielsen does since 1936: Understanding ‘Buy’, ‘Watch’, and the market itself.
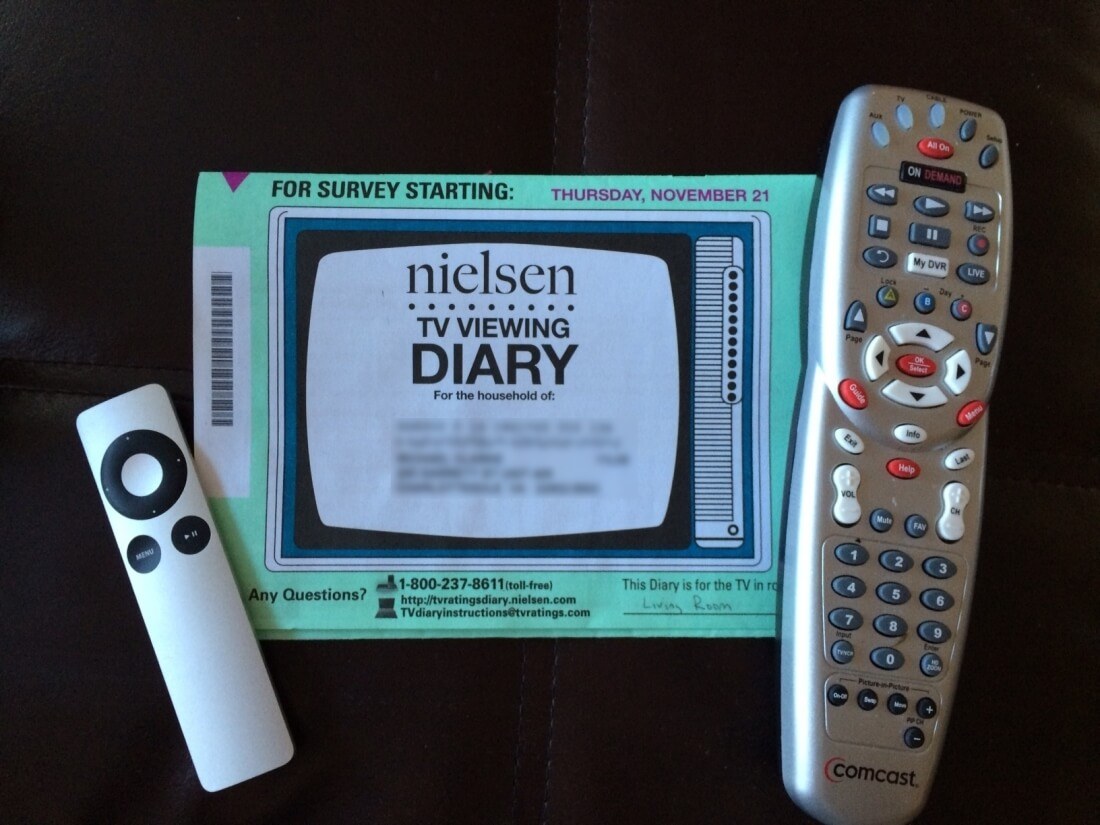
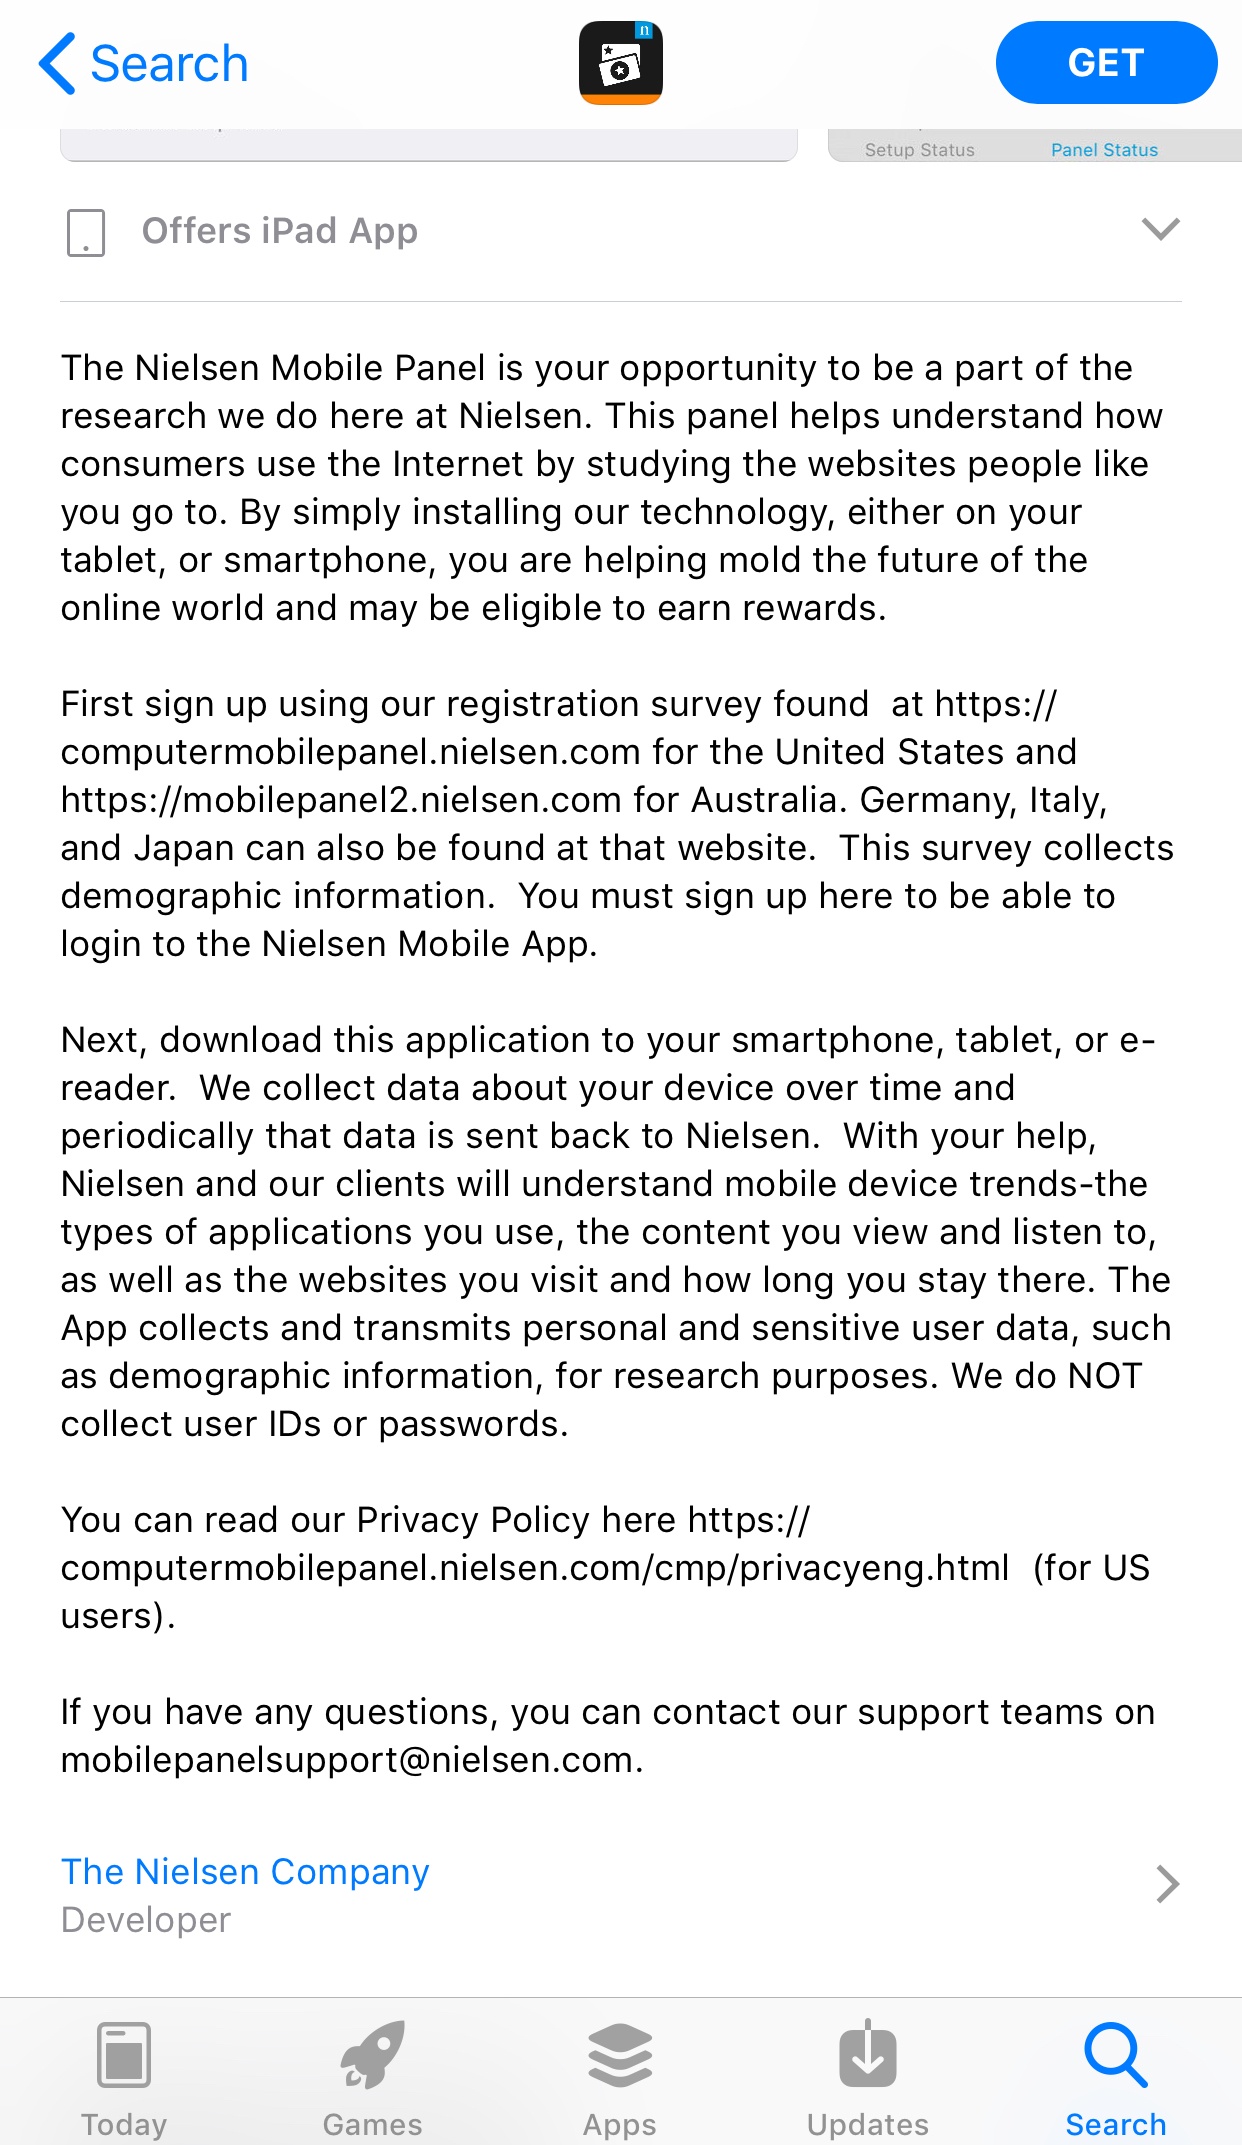
With around 25% of revenues come from TV ratings, Nielsen brand is very associated with it. But that’s not just it. In 1936, Nielsen does the first audience measurement, it was called the Nielsen ratings. At that time, 1000 homes were surveyed about the radio channel they use. In 1950, they created a device attached to a television to track what is watched. In addition, the ‘Nielsen families’ are also given diaries. They were registered by also giving their demographic info. So, in the end, Nielsen will know the demographic breakdown of its viewers. However, this diaries method has been retired in mid-2017 and replaced by different technology. In 1980, Nielsen made people meter, a device which looks like a remote control with buttons for each family member and guests. Viewers push a button to signify whether or not they are still watching the television. It was harder in the surveyed customer side, but this kind of design provided more detailed data about each individual behavior representing each demographics. And in 2008, they start to gather the data from internet and mobile devices. With 2.2/5.0 ratings in Apps Store, Nielsen apps user complaints about its pretty intense tracking activity which make some devices become much slower.


Value capture and creation
Now, with the data from more than 60 million households representing 905 of world populations from more than 100 countries, Nielsen achieved around USD 60 million annually in 2016. Their clients are upper middle and multinational company which value the consumer relationship management and consumer insights. It provides the integrated report, customized research, the technology of data capture/survey tools, and innovative research methodology. Reporting segments of Nielsen are
- ‘Buy’: Consumer purchasing measurement and analytics for retail data, store data, and match it with household panel data.
- ‘Watch’: Media audience measurement and analytics of TV, radio, computers, mobile, programming.
- Market: Measure current performance, how to improve, how to strengthen the market position, and how is the market dynamics.
On the other side, its competitor in Southeast Asia, Markplus Inc, also provides strategy on how to check product availability and also distribution chain. Nielsen’s strength is their brand is popular as an experienced company of the field, the information provided in real time and a lot of the market research are published for free.
External sources:
nielsen.com
Thanks for the post. Having worked in a consumer goods company before, I used Nielsen reports extensively and am familiar with all 3 directions they offer services in. I used a lot their “Buy” direction to analyze sales and distribution vs. competitors. Nielsen limitation in retail has always been coverage of the supermarkets with the available data: the less developed market was the less coverage Nielsen would provide (between 20% and 80% maximum of the available stores), which I found at times could be very misleading. I wonder whether Nielsen could overcome this historical challenge by investing in new technology, that does not necessarily require the supermarkets to reveal their data (which has been the bottleneck until now), but instead tracking the item from the warehouse all the way to consumer. Such technology could improve Nielsen coverage dramatically and bring more value to the companies it works with.
Interesting post Nandx. I wonder if Nielsen is looking into artificial intelligence applications for satellites to better assess demand in real-time. For instance, data analytics companies are using satellite surveillance of parking lots to determine current and future demand based on the number of cars in the parking lots of malls and supermarkets.
Great post! An interesting challenge I think Nielsen faces in the age of digital marketing and particularly many different digital video platforms is the fact that they are no longer the only source of that data – now Facebook, YouTube, Hulu can actively track video views for every advertisement and clicks to websites. So brands now are using Nielsen data but also compiling that data with these other sources of analytics to inform their marketing strategy. Interestingly, they started including Hulu and YouTube TV as part of their data package this summer as a reaction: http://www.nielsen.com/us/en/press-room/2017/hulu-and-youtube-tv-now-included-in-tv-ratings-announces-nielsen.html
Interesting post! I actually worked for Nielsen for 4 years before school on the Buy side working with two big CPG clients to help them understand and use all of the data they bought from us. While my clients revenues flowed mostly through the grocery, super store, and drug store channels, I’m interested in how Nielsen will adapt to the changes in consumer behavior with the rise of Amazon and online shopping. In the US, Nielsen captures sales information from cooperating retailers POS data (point of sale), and through the household panel (a group of ~100K sample households who scan every bar code of items their household buys). The POS data is closer to whole than the projected sample household data, but it misses sales from non-cooperating retailers – like Amazon – who are becoming a growing share of the consumer wallet. While Nielsen has been the one-stop-shop to get all your data historically, with changing consumer habits, I’d imagine more CPG companies are having to go to multiple sources to view and analyze their sales data and customer demographics. More sources, more data, more challenges to marry the data up and analyze it…doesn’t sound fun! I wonder what Nielsen will do in the future to remain competitive as retailers become protective of their data, and as consumer habits continue to evolve.